


Blueprint+ (Service Design Visual)
April 14th, 2010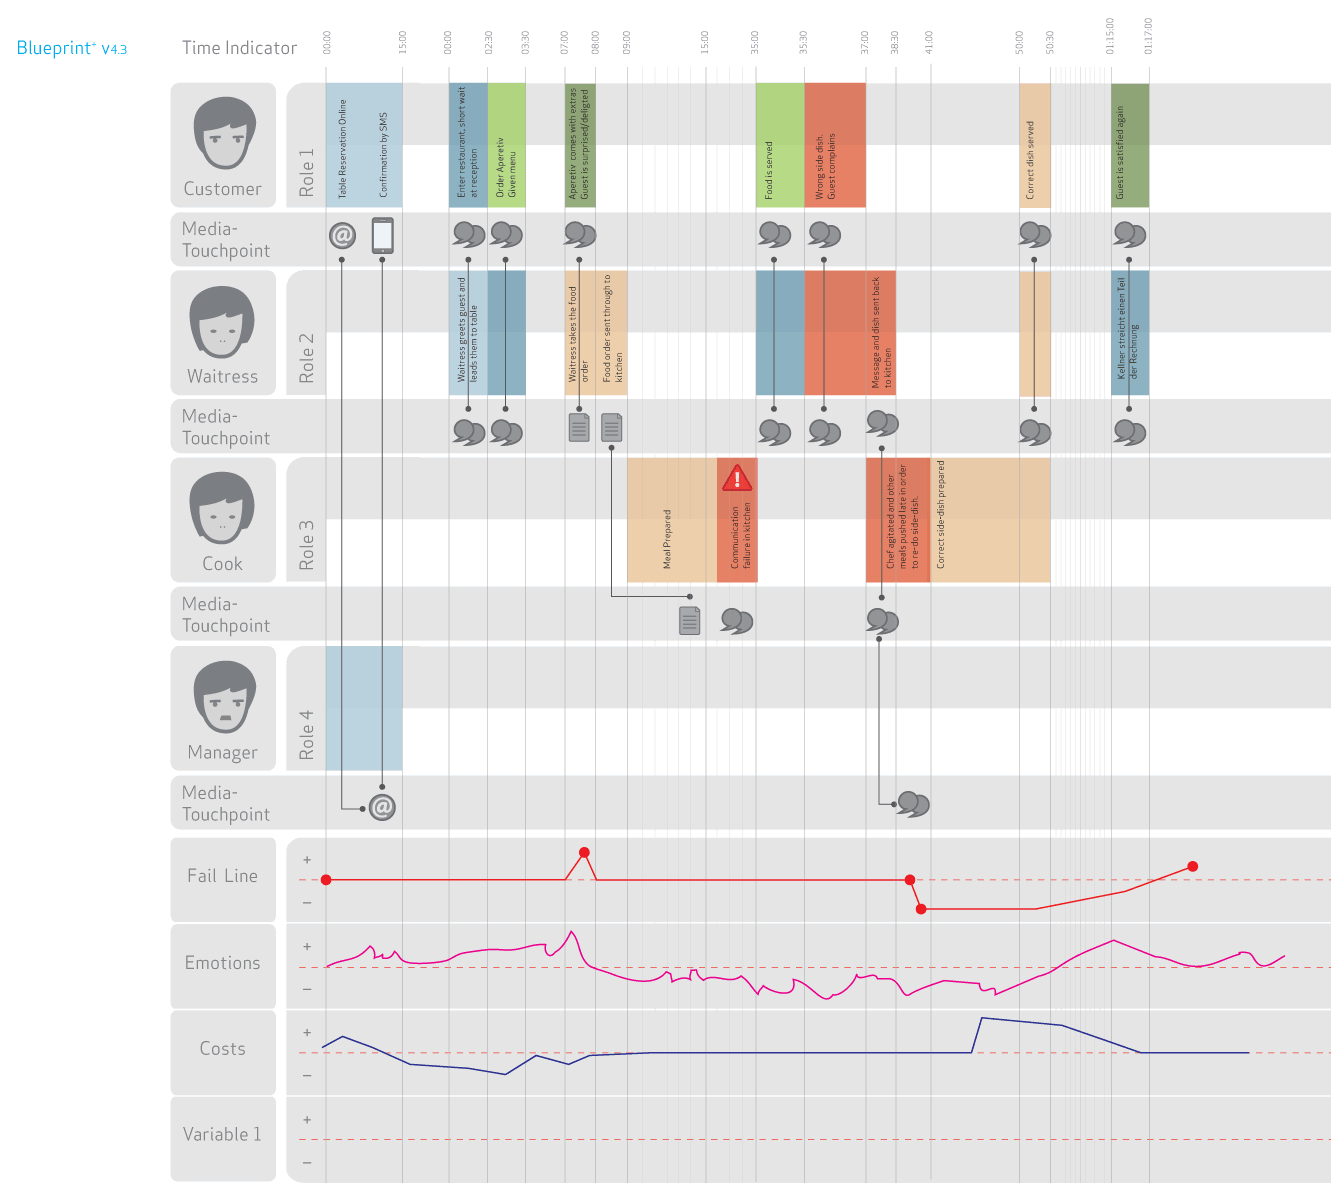
The academic group over at Hochschule Luzern (Competence Center) in Switzerland have recently explored a visual representation that captures the interaction of various people across multiple services or touch points. Done in the context of a service design assignment, the Blueprint project portrays the flow of time horizontally and captures multiple actors vertically. More so, the visualization also layers additional data underneath and contains such things as fail lines, emotions and costs, while at the same time leaving more room for additional variables. In some way, the deliverable shares some resemblance to the Experience Maps posted earlier.
As an additional note, Blueprint+ is still a work in progress and will be turned into a toolkit in the future. Stay tuned. :)
Credits: CC Explanations and Services, Hochschule Luzern (Andy Polaine, Roman Aebersold, Robert Bossart and Andrea Mettler)
2 Responses to “Blueprint+ (Service Design Visual)”


April 14th, 2010 at 1:54 pm
Can't wait for the tool kit!
April 16th, 2010 at 4:40 am
just about it:http://www.servicedesigntools.org/tools/35